RET-2 Win-back offer at day 45 - Expects
- 22.4% → 24.0%repeat within 90 days
- Undone if
- margin per order drops over $0.40
Live on this pageOpen a company's Brain
AI is smart, but it has no experience of your business. Veloccy gives it that experience, and puts it into every bet your team makes.
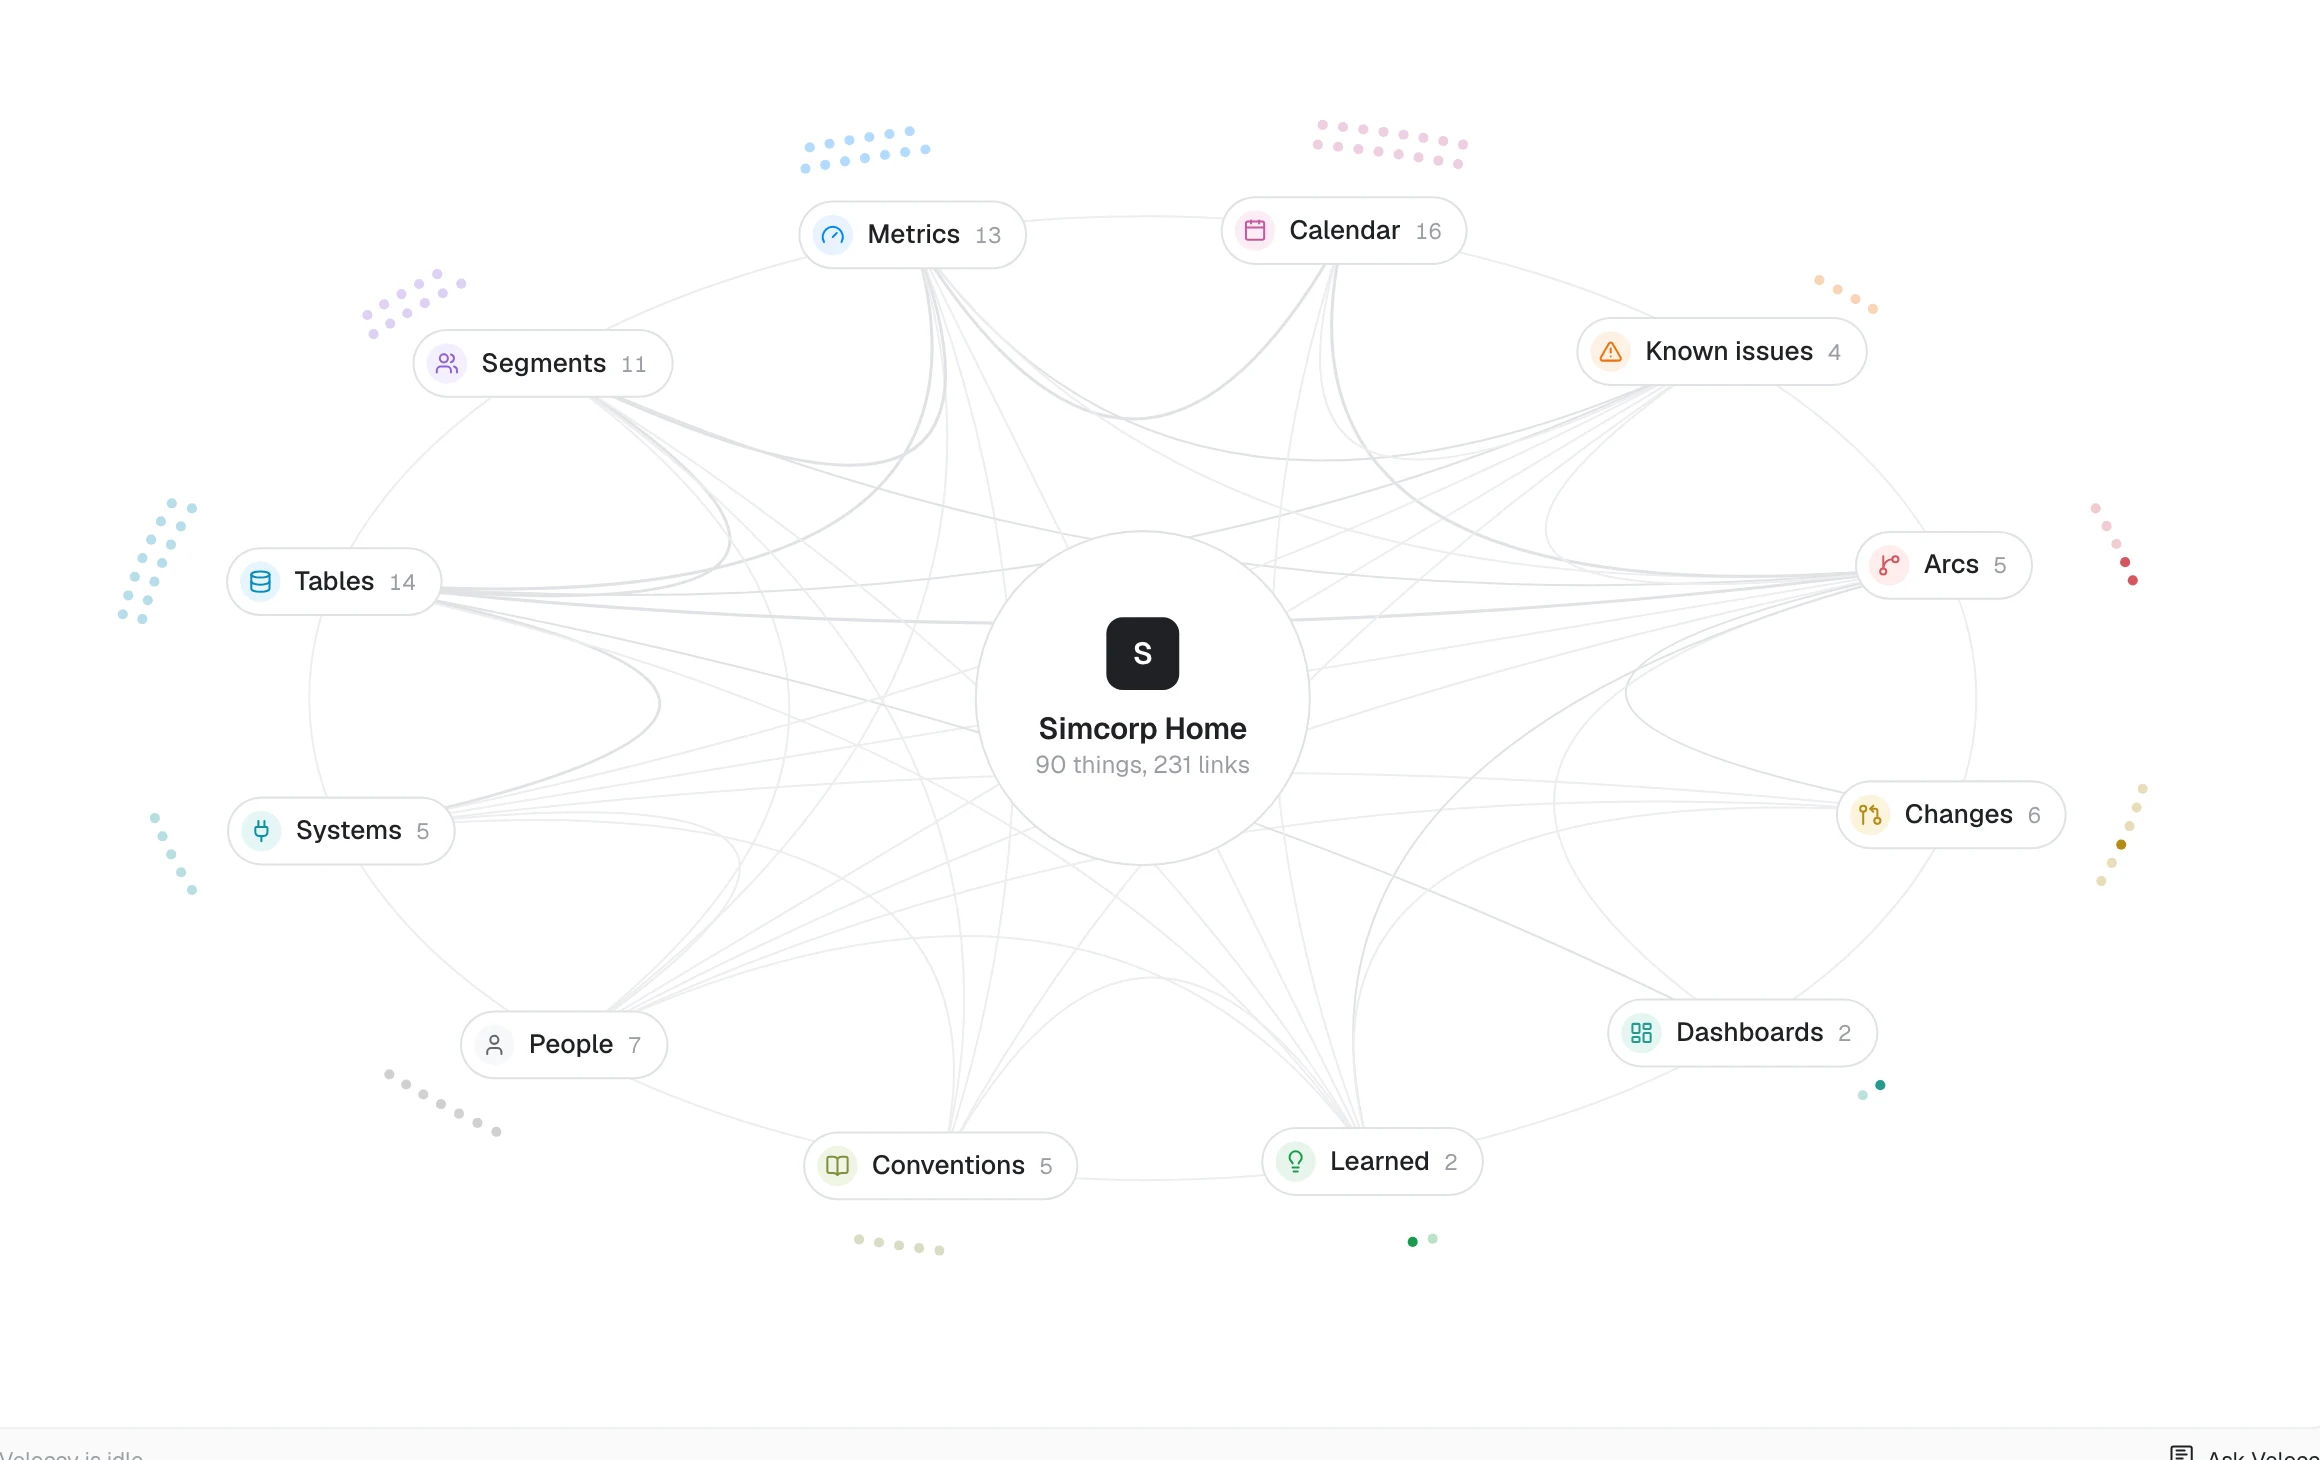
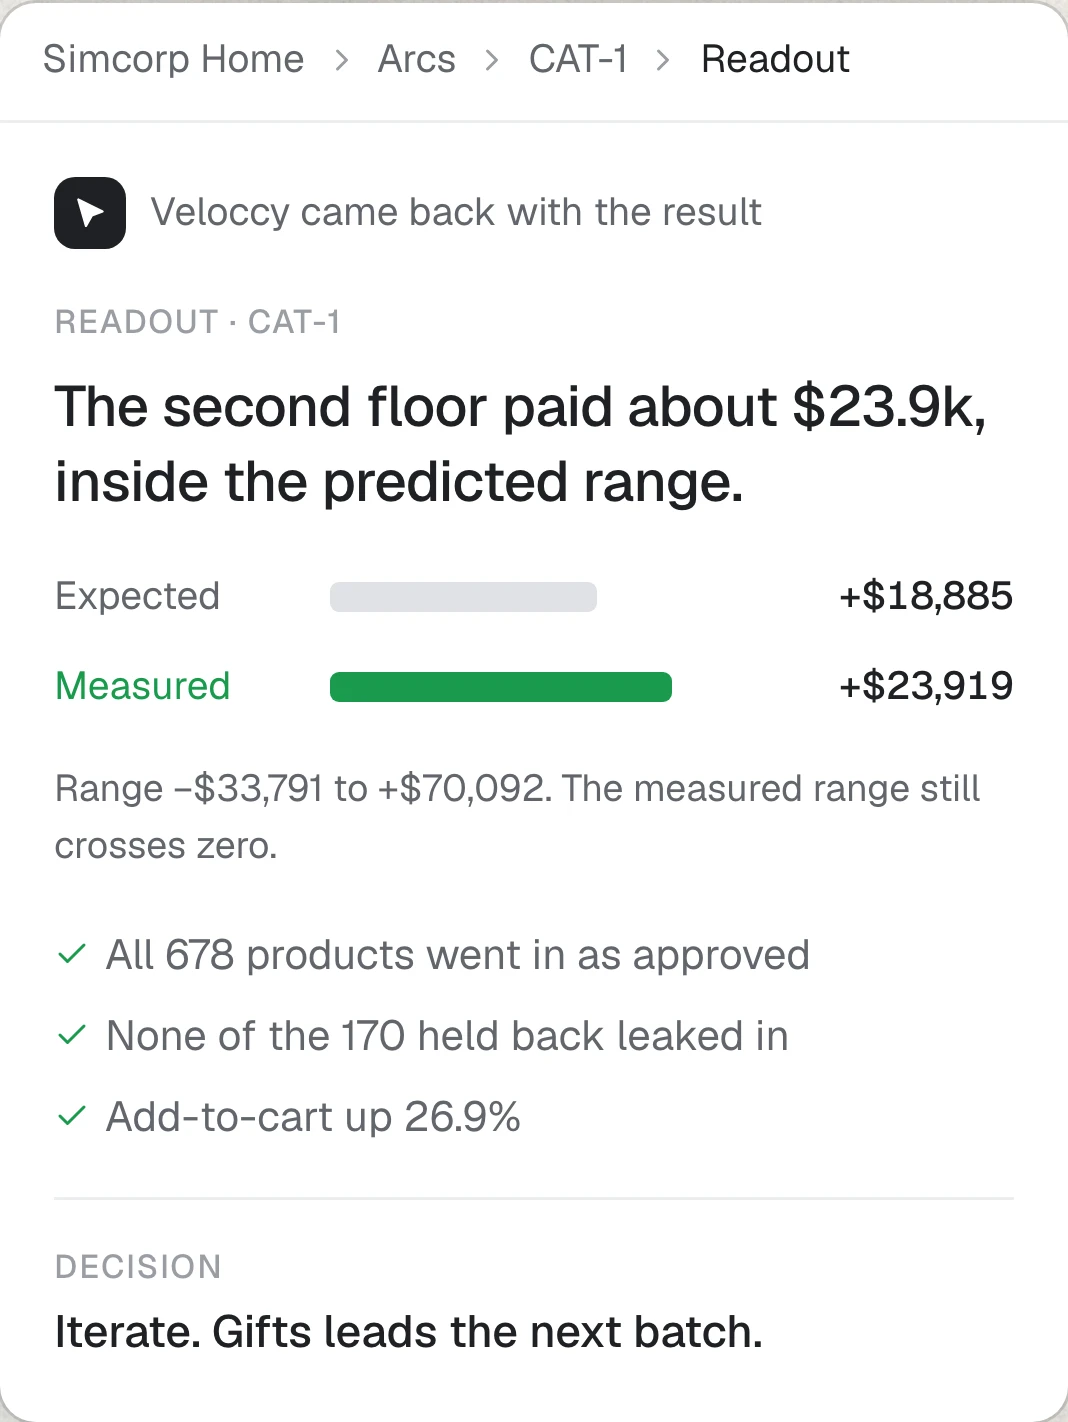
RET-2 Win-back offer at day 45 PM-1 Block two placements, keep the budget OPS-1 A second lunch line CAT-1 Stock 678, leave 822 empty SUP-1 Next-day on 857 products PRC-3 Free delivery from $35 APP-4 One-tap reorder PM-3 Move 15% of search to creators SUP-4 9 days of cover on top sellers APP-6 Delivery time on every product CAT-4 Drop 60 slow bedding sizes GRO-5 Referral credit from $5 to $10 OPS-3 Two evening delivery waves incremental_contribution RMRyan Mercer opened 29 Sep review 9 Dec The second floor paid about $23,919, inside the range Veloccy wrote down before anything shipped.
The next-day badge lifted add-to-cart by 26.9%. The payoff range still crosses zero, so it probably paid and that is not proven yet.
The full answerIterate. Do not make the 678-product assortment permanent. Gifts leads next season, and Lighting & Festive returns only for a festive window, with its own products held back.
Lighting & Festive comes back only for a festive window, with its own products held back.
Owned by Anna Keller.
Do not fill 1,500 slots before Diwali. Stock 678 products of the kind the first floor proved, with 1,396 opening units, keep 170 like them supplier-fulfilled to compare against, and leave 822 slots empty. The best estimate clears the 22.1% break-even lift, but the low end of the range loses money.
| category | stocked | held back | opening units | predicted net |
|---|---|---|---|---|
| Gifts | 539 | 135 | 1,087 | $11,556 |
| Lighting & Festive | 98 | 25 | 225 | $5,470 |
| Decor | 41 | 10 | 84 | $1,859 |
| Total | 678 | 170 | 1,396 | $18,885 |
It worked. The overall lift of 26.9% is above the 13.1% line written down before the test, and even the low end of its range is above zero. Gifts and Lighting & Festive are each positive on their own. Decor points the same way but is not conclusive.
| category | stocked, before → after | held back | lift |
|---|---|---|---|
| Total | 4.77% → 6.50% | 4.86% → 5.22% | +26.9% |
| Decor | 4.33% → 5.51% | 4.31% → 4.56% | +20.4% |
| Gifts | 4.34% → 5.92% | 4.60% → 4.77% | +31.6% |
| Lighting | 6.23% → 7.90% | 6.15% → 6.51% | +19.7% |
The best estimate says the test paid about $23.9k, driven by Gifts. Lighting & Festive lost $11.7k. The range, −$47.7k to +$94.3k, crosses zero, so the payoff is not proven.
| category | units sold | without the badge | net payoff | range |
|---|---|---|---|---|
| Gifts | 674 | 635.8 | $32,472 | −$29,937 to $97,533 |
| Decor | 150 | 116.8 | $4,359 | −$7,953 to $16,454 |
| Lighting & Festive | 539 | 494.8 | −$11,748 | −$42,229 to $13,050 |
| Total | 1,363 | 1,225.6 | $23,919 | −$47,745 to $94,337 |
CaveatsHandling is a floor, because receipts are not logged. Stock left at the close is charged at what it costs to return.
| where | what | from | expected cost |
|---|---|---|---|
| Second floor · Gifts | Stock 539 products, open with 1,087 units | 6 Oct | $84,733 |
| Second floor · Lighting & Festive | Stock 98 products, open with 225 units | 6 Oct | $30,520 |
| Second floor · Decor | Stock 41 products, open with 84 units | 6 Oct | $8,725 |
| Held back | Keep 135 Gifts, 25 Lighting & Festive and 10 Decor products supplier-fulfilled, without the next-day badge, until 8 Nov | 6 Oct | $0 |
All 678 stocked products are on hand at BLR-1 with the next-day badge live, and none of the 170 held back has one. Nikhil’s message that it was done is kept separately; the change stayed approved until the warehouse data agreed.
Add-to-cart for stocked against held back rises 13.1% to 18.3% by 8 Nov. Net contribution is +$18,885 (−$33,791 to +$70,092). It worked if add-to-cart is up at least 13.1% and the final net contribution is positive on 9 Dec.
Stop replenishing a category if its add-to-cart falls behind the products held back, or its returns run more than 0.5 points above them, two weeks in a row. Remove the badge and return the remaining stock.
| category | stocked | held back | opening units |
|---|---|---|---|
| Gifts | 539 | 135 | 1,087 |
| Lighting & Festive | 98 | 25 | 225 |
| Decor | 41 | 10 | 84 |
| Total | 678 | 170 | 1,396 |
| scenario | demand lift | net contribution |
|---|---|---|
| lower | 7.0% | −$33,791 |
| point | 30.5% | $18,885 |
| upper | 58.6% | $70,092 |
| metric | threshold | unit |
|---|---|---|
| Add-to-cart worked | 13.1 | % lift |
| Smallest lift the test can see | 10.7 | % lift |
| Demand break-even | 22.1 | % lift |
| group | returned | failed delivery |
|---|---|---|
| stocked | 4.12% | 1.83% |
| held back | 6.67% | 3.17% |
My Claude already has MCPs and connectors to figure all this out.


A new joiner gets every login on day one. Even the most intelligent one will not read your numbers as well as someone with experience of your business.
Veloccy gives AI that experience.
Why is ROAS sitting near 2.5, and should we pull the budget back before the festive build?


It fell after the budget went up, so pull the budget back.


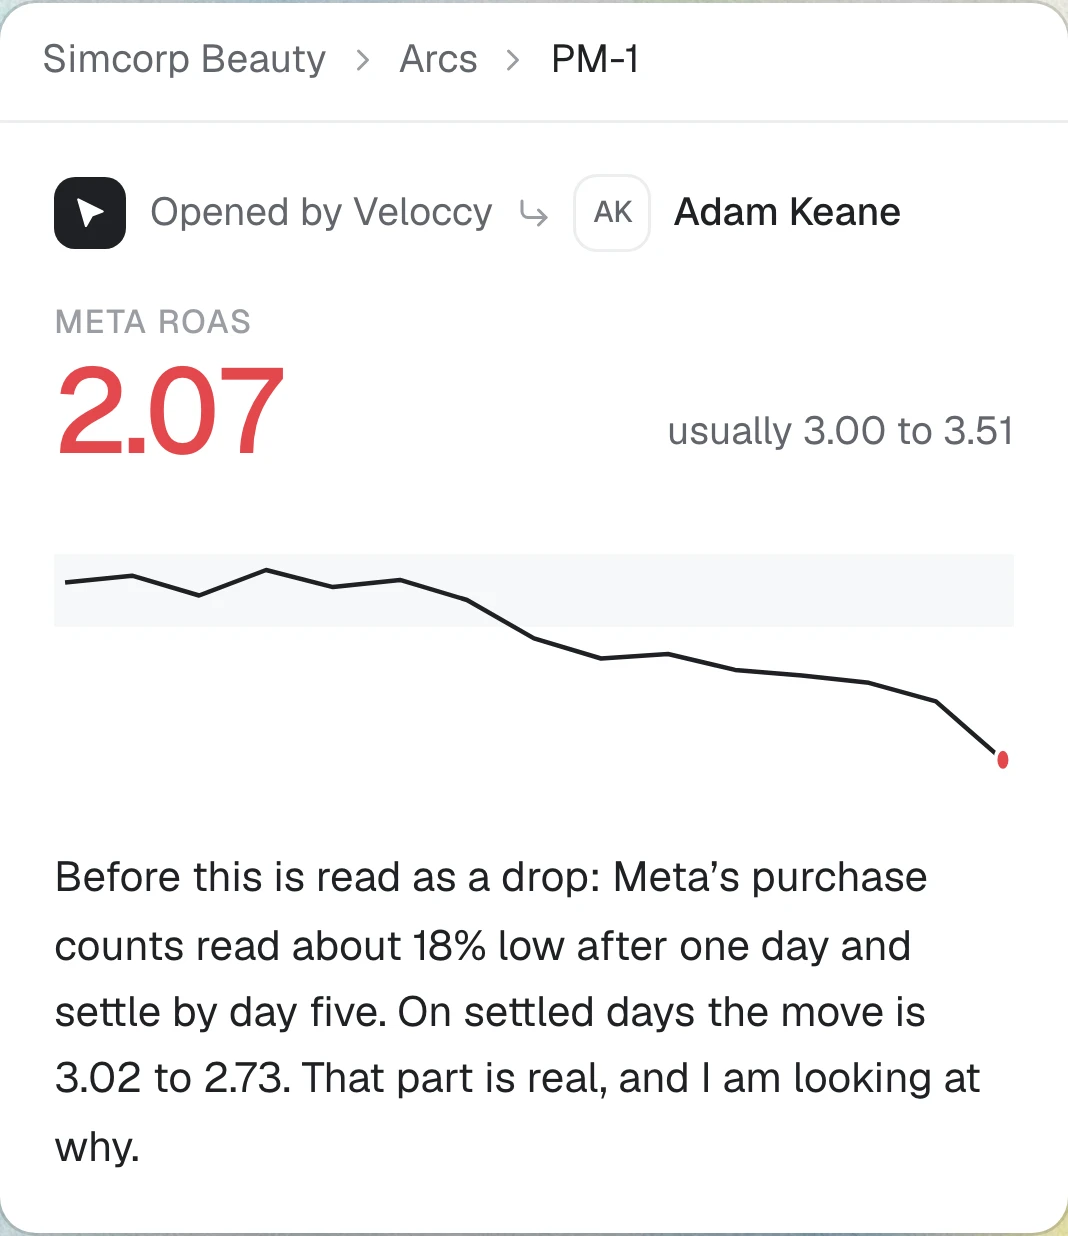
The BrainPart of the drop is not real yet. Most of the rest is a setting Meta changed at 3 a.m. The budget is fine.
On settled days the move is 3.02 to 2.73. @Adam Keane owns the ad account, and decides.
This one belongs to a home marketplace, and it is live. Scroll, or click anything in it.This one belongs to a home marketplace.
Nobody fills the Brain in by hand. It builds up from three things that are already happening in your company.
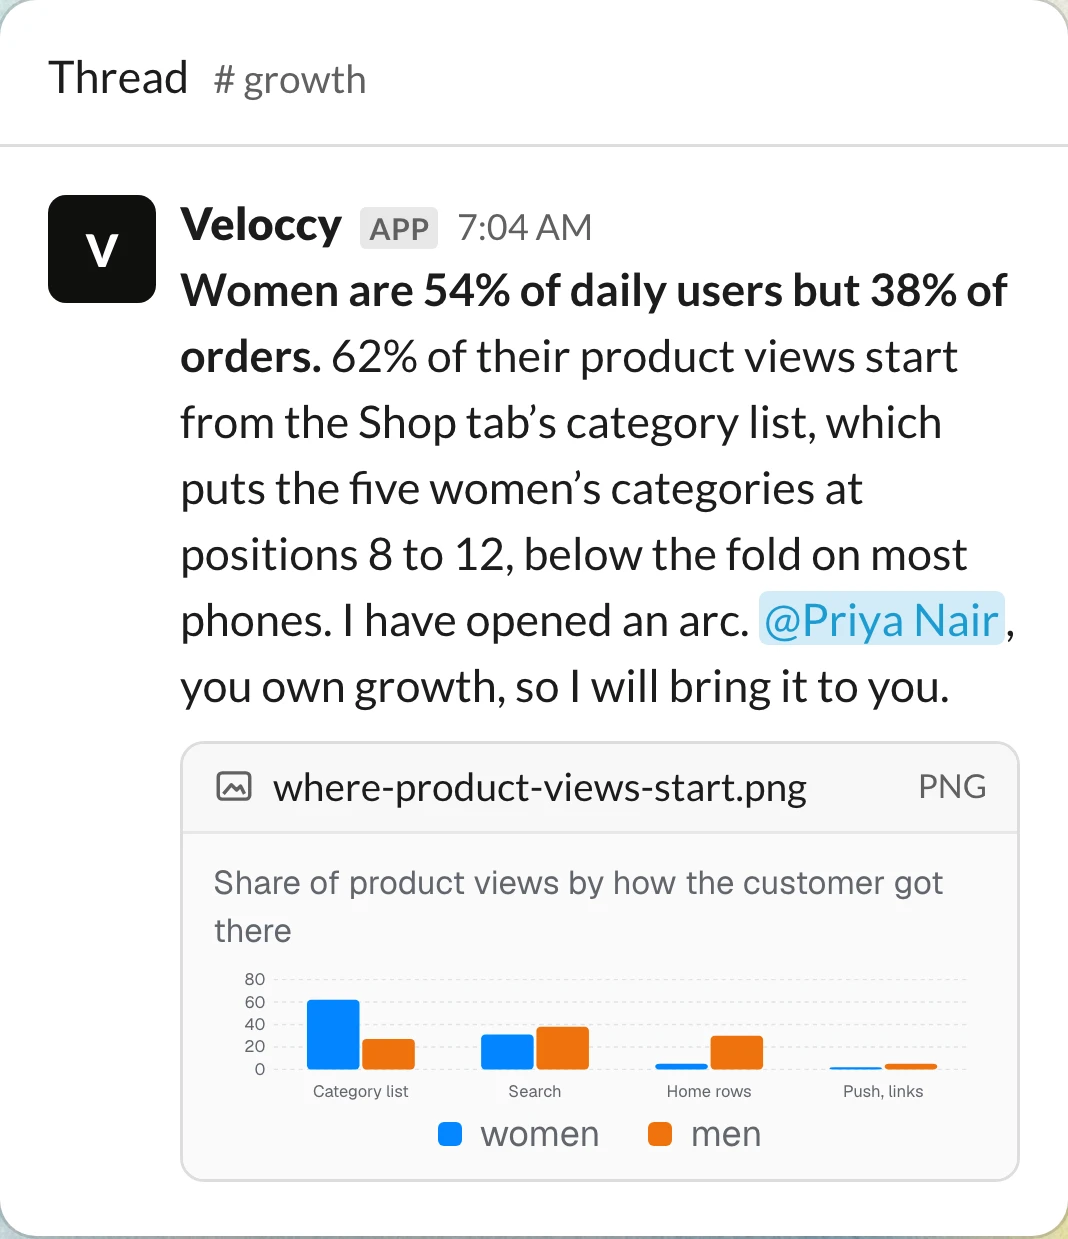
Women are 54% of daily users but 38% of orders. I have opened an arc.
It checks every number against its usual range, all the time, without being asked. When something moves, it takes it to the person who owns it. It looks for openings as well as problems.
The data shows what changed. For why, Veloccy reads what the team said in Slack, on WhatsApp and on calls. When the why is not there, it asks the person it knows can answer.
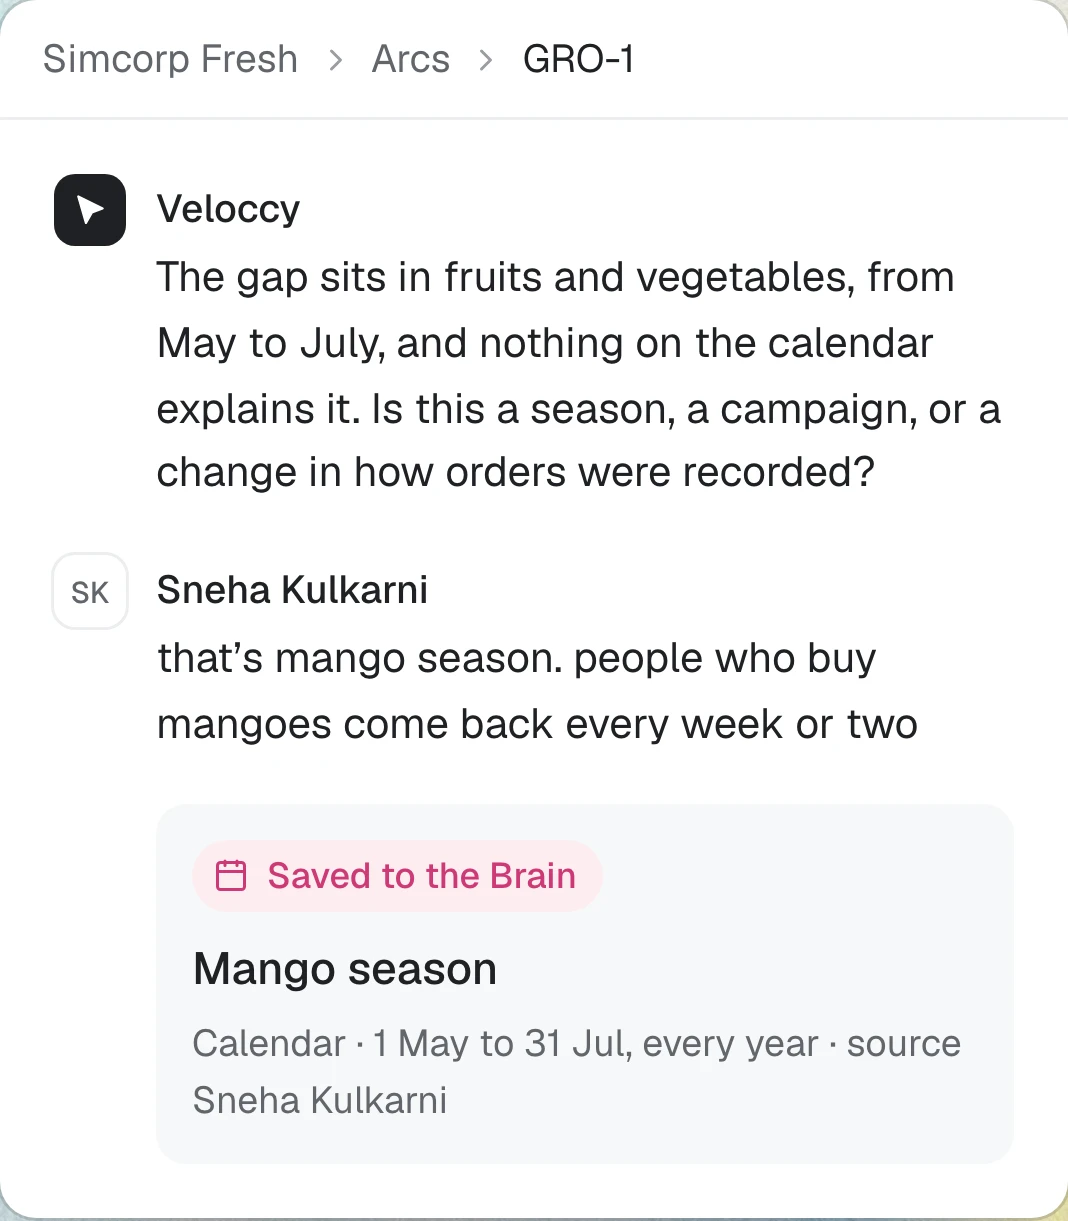
that’s mango season. people who buy mangoes come back every week or two
They ask it to analyse, plan, test and build. When someone corrects it, Veloccy keeps the correction and uses it in everyone’s work from then on.
Two months after the second-floor bet, the person who made it came back with a new question.
More than half of the second floor is still sitting empty, and wedding season is starting. What should we fill the empty slots with?
Queried the connected warehouse63 queries
Nikhil, short answer: fill it with SKUs that already sell fast, not with wedding stock. I could not find a wedding season in our sales, and the second floor is half empty mainly because the October batch put stock on the wrong SKUs.
What I would put in, in this order
| Order | What | SKUs | Units a month |
|---|---|---|---|
| 1 | Fast movers that are not at BLR-1 yet (non-fragile) | 118 | 7.4 |
| 2 | Restock the October SKUs that do sell | 134 | 2.2 |
| 3 | Next tier of non-fragile sellers not at BLR-1 | 149 | 2.2 |
| 4 | Fragile dining and decor, as a pilot | 119 | 5.6 |
Orders 1 to 3 at a month of cover come to roughly 1,500 to 1,700 units across about 400 SKUs.
A careful list of 844 products, ranked on units sold. It fills slots left empty on purpose, mostly with the kind of product that already lost money here.
What should we fill the empty slots with?
Don’t fill it.
Those slots were left empty on purpose.
Stock 678 products, leave 822 slots emptyCAT-1
ChangeNRApproved by Nikhil Rao29 Sep
The products that would go in already lost money here.
Next-day pilot payoffSUP-1
ArcGifts paid. Bedding and kitchen lost.−$294,403
Veloccy knows the slots were left empty on purpose, and that bedding and kitchen lost money on the first floor. All of it is in the Brain.
Claude’s list went onto the shelves on 14 December. Each week shows what the plan had made or lost by then, after the cost of stocking it.
Bedding−$87,889Bath−$67,924Kitchen−$44,961
Claude did careful work with what the warehouse could tell it. The decision behind the empty slots and the first floor’s result are in the Brain.
Claude Opus 5.5 with read-only SQL on the same warehouse, one run. A demonstration on a simulated company, not a benchmark. The Claude window is a recreation; the words in it are Claude’s.
A bet takes digging, waiting for the one person who would know, and checking afterwards. Veloccy does that work with your team, in Slack, on WhatsApp and in your meetings, so your team makes more bets.
This is one bet at a fashion store, from 18 August to 4 September. Priya Nair owns growth.
62% of their product views start from the Shop tab’s category list, which puts the five women’s categories at positions 8 to 12, below the fold on most phones.
I have opened an arc. @Priya Nair, you own growth, so I will bring it to you.
The order. The chance a position is opened falls the same way for everyone as you go down the list. 44% of women who open the list leave without opening any category, against 21% of men.
Women’s orders per active user up about 8.6%, roughly 1,200 orders a week.
Men’s list-to-category and AOV stay within 2%.
One list for everyone, in the shipped order, if a limit is outside 2% over any 3 days.
THTomás Herrera, who owns the storefront configHLHannah Lindqvist, women’s merchandising
Per-audience ordering works since 4.10. The nav config is cached for six hours.
Fine by me as long as Sneakers stays in the top five for both lists.
approved, run all threeApproved · 12:31 PM
shop_tab.lists1 list2 lists, by audienceorder · womenMen’s Tees, Men’s Shirts, Sneakers …Dresses, Women’s Tops, Skirts, Sneakers …pinned.top5–Sneakers · shared, highest marginApplied at 12:40 PM, with Tomás’s and Hannah’s conditions on the change.
If men’s numbers or AOV move more than 2%, Veloccy puts the list back and says so in #growth.
yes to both. this is great 🙏
Your data and your tools stay where they are. Veloccy connects to what you already run.
See the workspace, screen by screenEach of these ran on a simulated company where we planted the cause, so we know what the right answer was. In every one, the obvious answer from the data was wrong, or there was no question to ask.
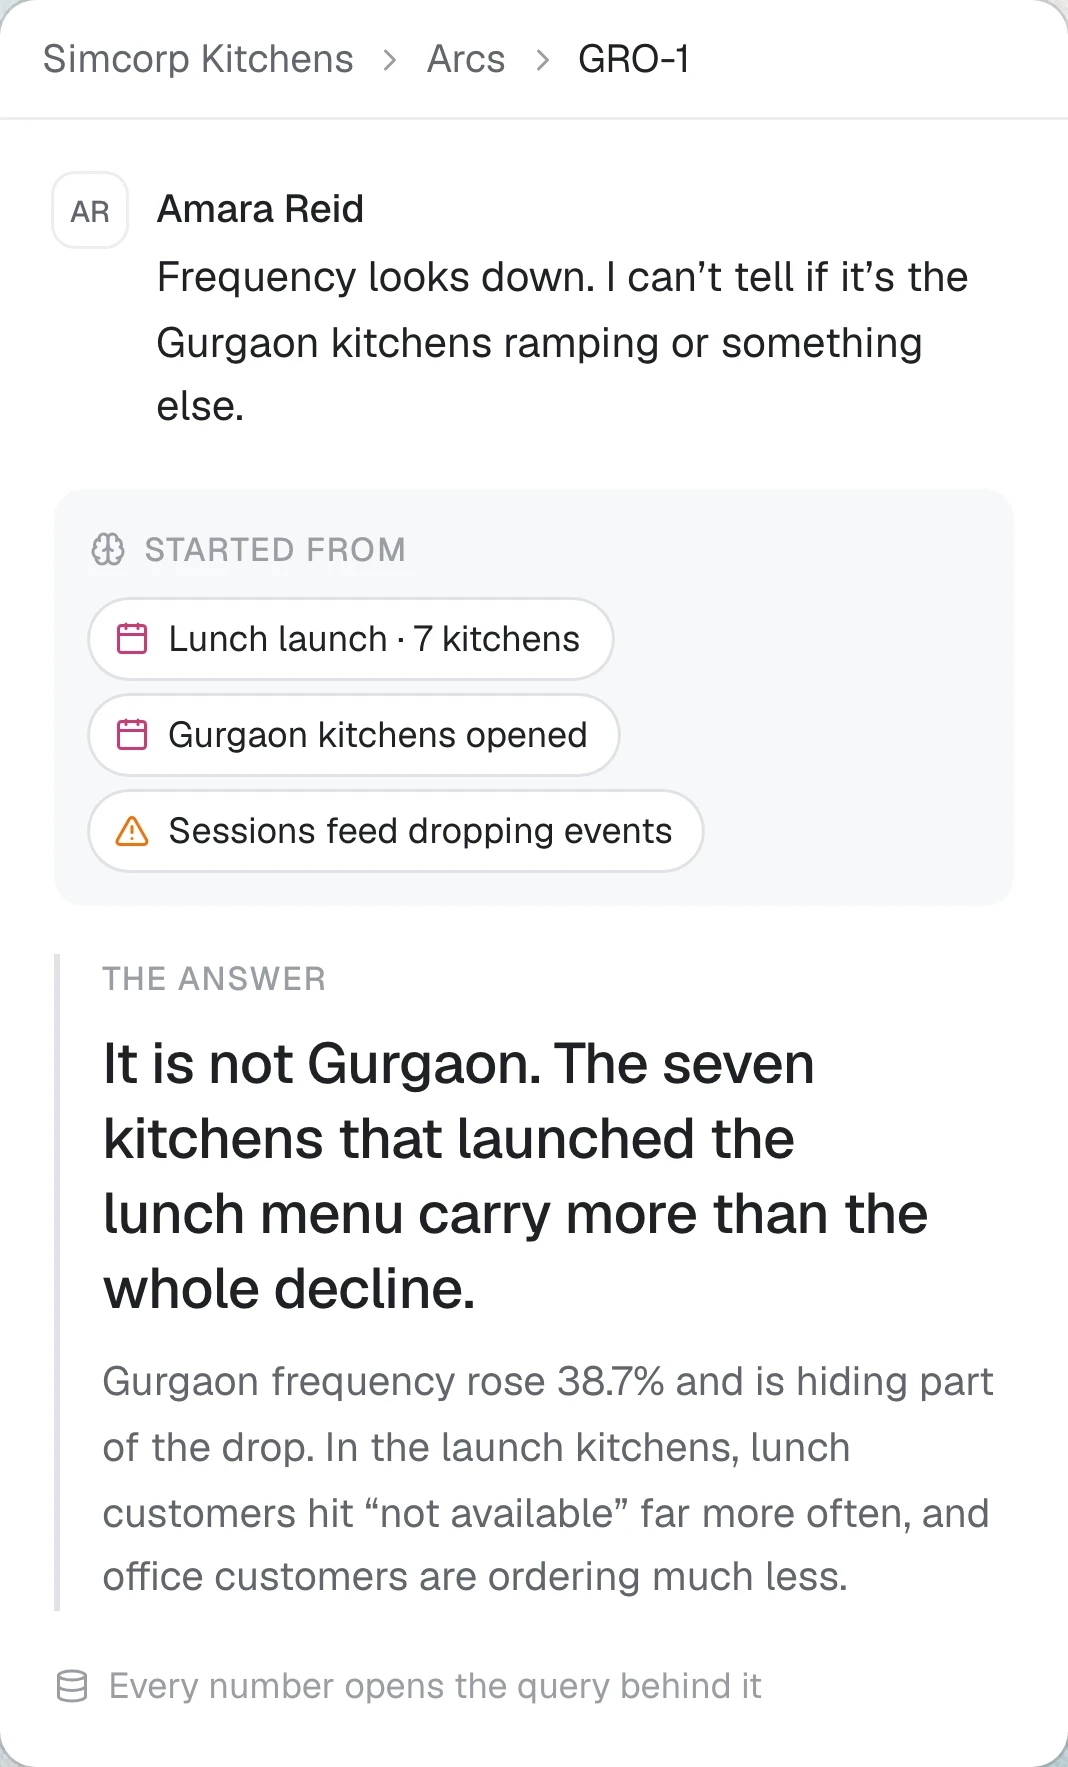
Three new kitchens, still ramping up. Their frequency rose 38.7%.
132.6% of the decline sits in these seven.
AI with accessPull the budget back.
AI with experienceThe budget is fine.
The gap sits in fruits and vegetables, from May to July, and nothing on the calendar explains it. Is this a season, a campaign, or a change in how orders were recorded?
that’s mango season. people who buy mangoes come back every week or two
Bigger first orders, against the rest
AI with accessNothing had dropped, so there was nothing to ask.
AI with experience+9.2% women’s orders per active user, after the test.
Women are 54% of daily users but 38% of orders. The five women’s categories sit at positions 8 to 12 in the Shop tab, below the fold on most phones.
approved, run all three
Women’s categories first won. Women’s orders per active user are up 9.2%, and men’s numbers and AOV held.
Tell us about it on a call and we will show you what Veloccy does with it. After that the setup is ours to do: we connect Veloccy to your data and tools, and build it around the bets your team is already making.